Facebook
 X
X
 Pinterest
 Copy Link
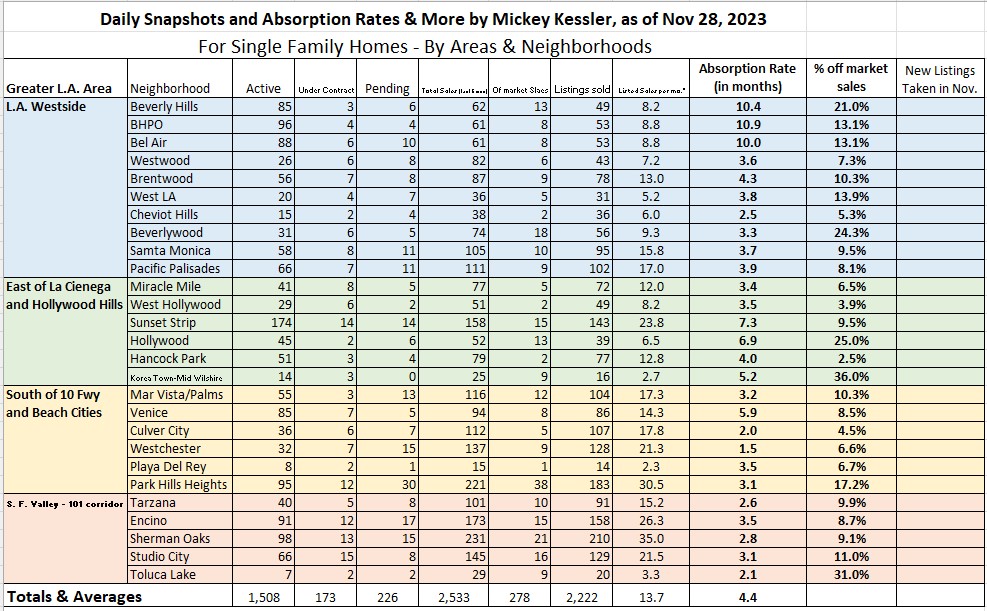
This Daily Snapshot chart that I prepared on 11/29/2023 breaks down market activity by neighborhood, and as a summary of the neighborhoods (bottom row). The data columns are as follows (left to right): Active Listings (homes on market), Listings Under Contract (homes with an accepted offer), Pending Listings (homes in escrow with an accepted offer wherein all contingencies have been removed), Total of Sold (Listed) Properties (over the prior 6 months), Total of sold (off market) properties (over the prior 6 months), Total Sold (total of listed and off market properties), Listed sales per month (listed sales divided by 6 (months)), Absorption Rate (ratio of sales per month and currently active listings). The resulting figure represents the time (in months) that it will take for all the active listings to sell if no new listings were to come on the market while the active inventory sold off. Absorption rate is an important tool for measuring the state of the housing market. An absorption rate of 0 (zero) up to but less than 4 months can be considered a Seller’s Market. An absorption rate of 6 or more months can be seen as a Buyer’s Market, and an absorption rate between 4 months and up to, but less than 6 months can be seen as being in an equilibrium between Buyer and Seller markets. The next column is the ratio of off market sales as a percentage of the total sales.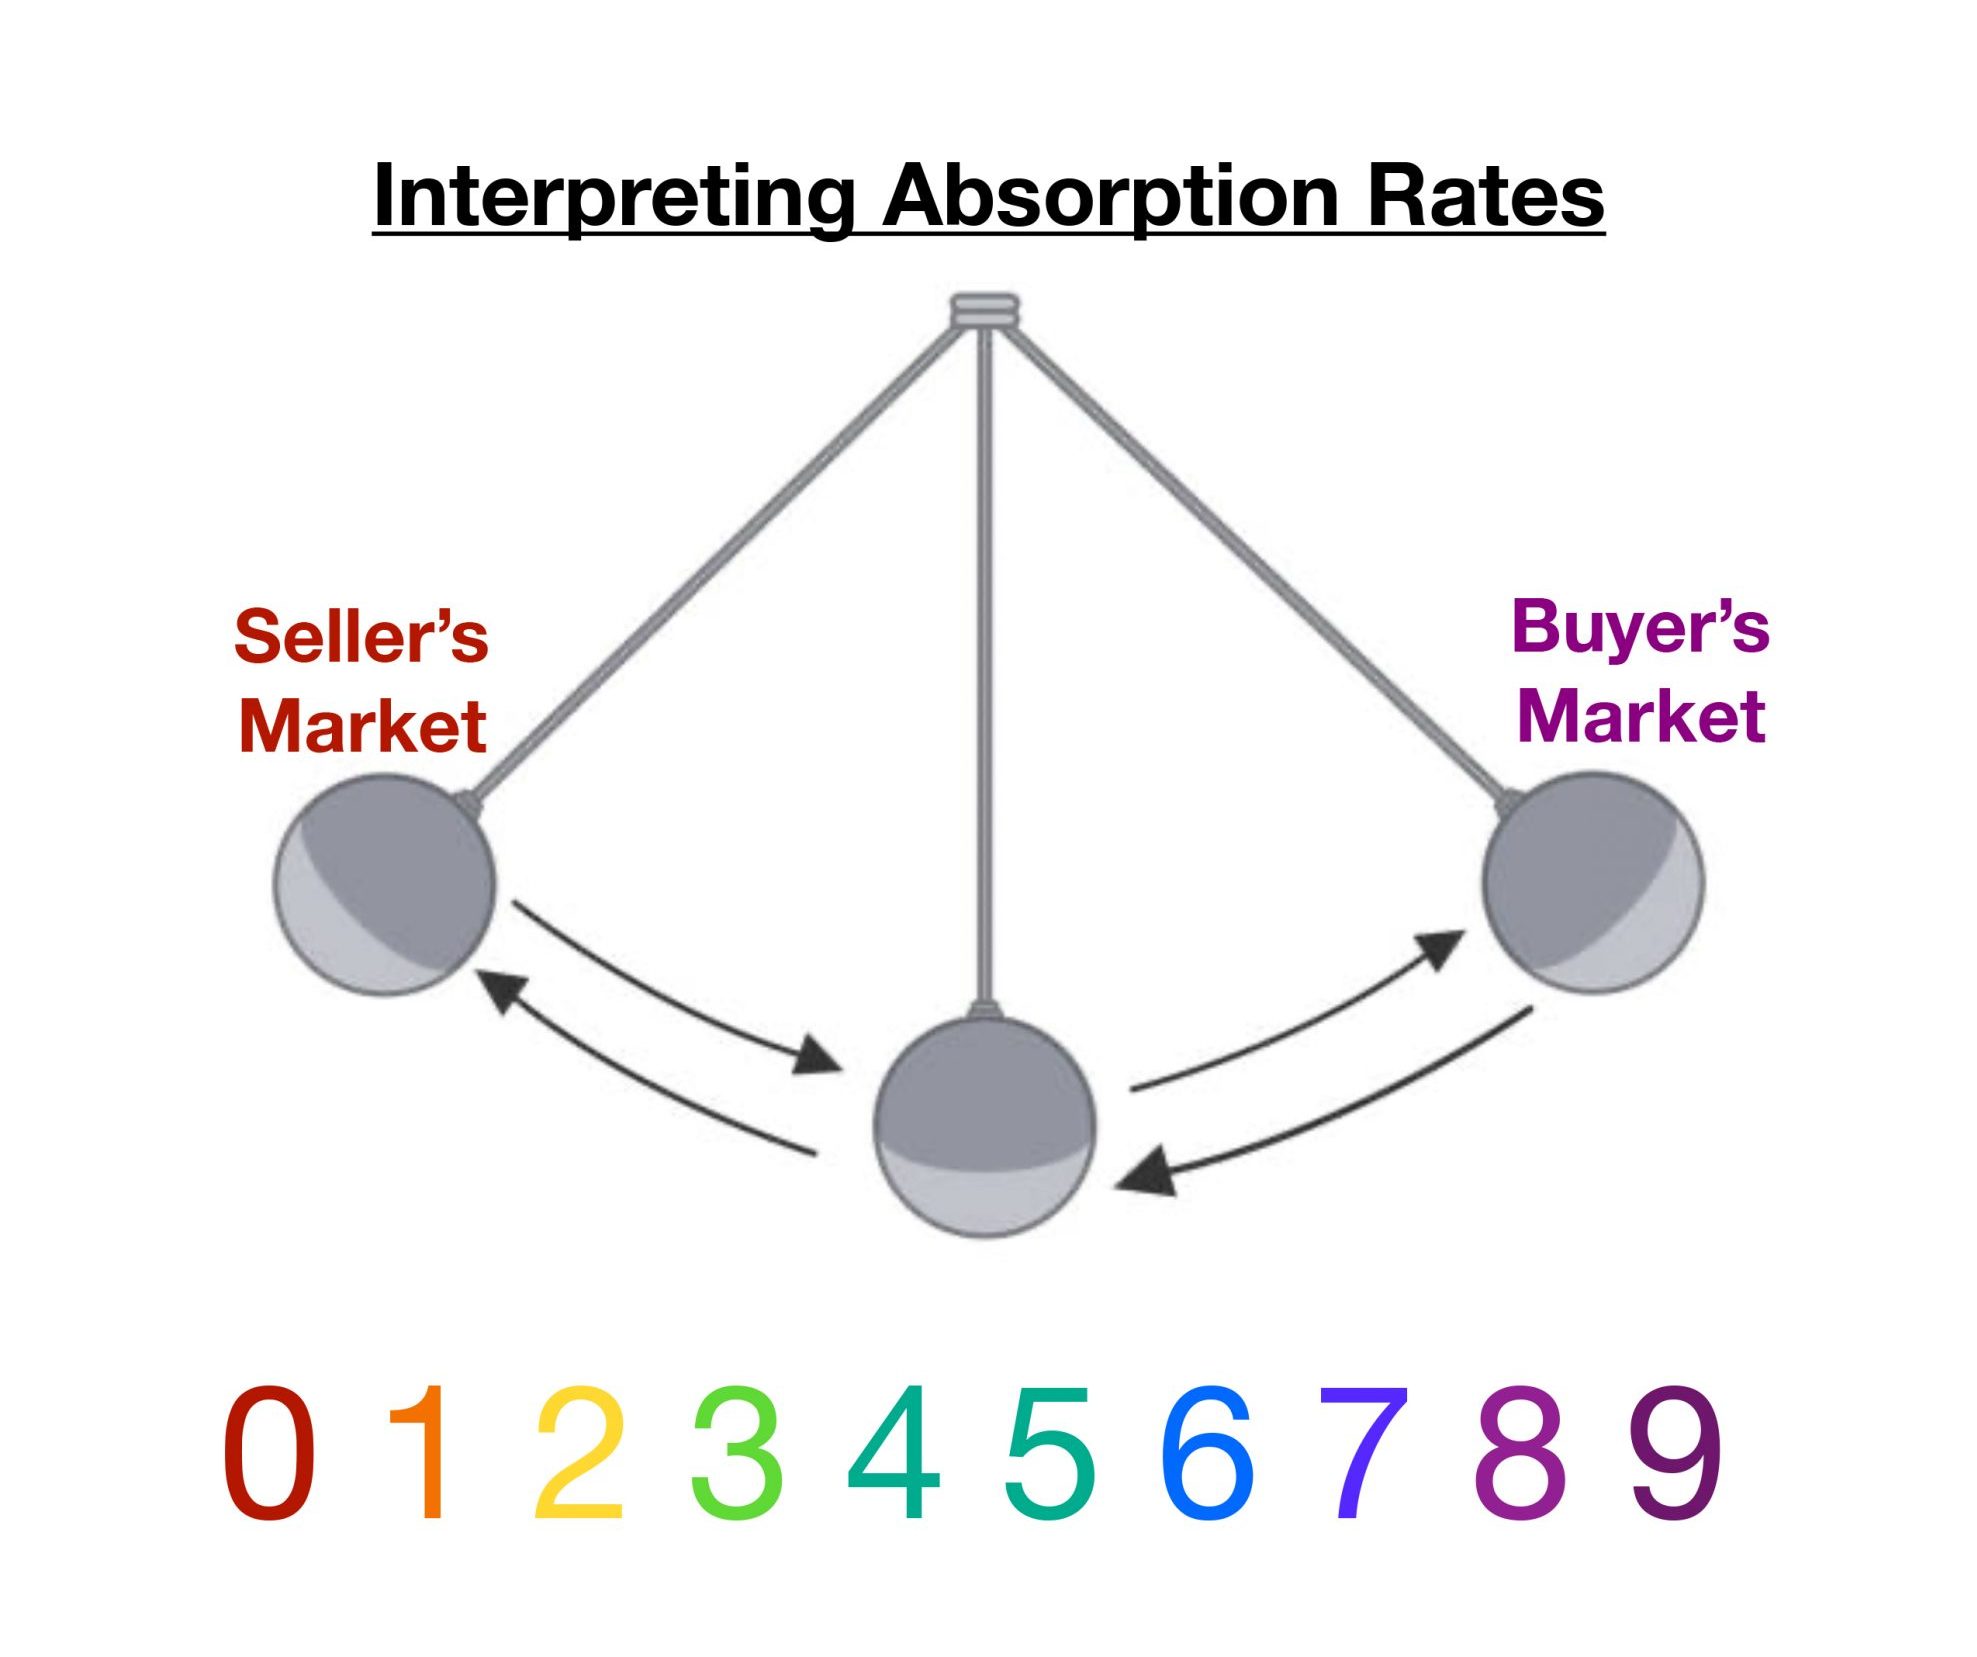
By reviewing the Absorption Rates by neighborhood note that a considerable majority of the neighborhoods are less than 4 months and would therefore be considered Seller’s Markets. Note that their are 3 neighborhoods (Beverly Hills, Beverly Hills Post Office and Bel Air) that have 10+ month absorption rates. These absorption rates clearly signal that these neighborhoods are experiencing a Buyer’s market. One explanation for this disparity could be the impact that the passage of Measure ULA has had on sales of homes with values of $5+ million dollars, which makeup a significant percentage of the properties located in the afore-mentioned neighborhoods. Such properties are holding out for top, top dollar to offset the new transfer taxes imposed by Measure ULA. Notwithstanding the noted exception, most of these neighborhoods are still good market to list and sell homes in.
And this opportunistic home-selling market is not exclusive to the Westside. The Valley neighborhoods that hug the Santa Monica mountains are performing very well for home sellers.
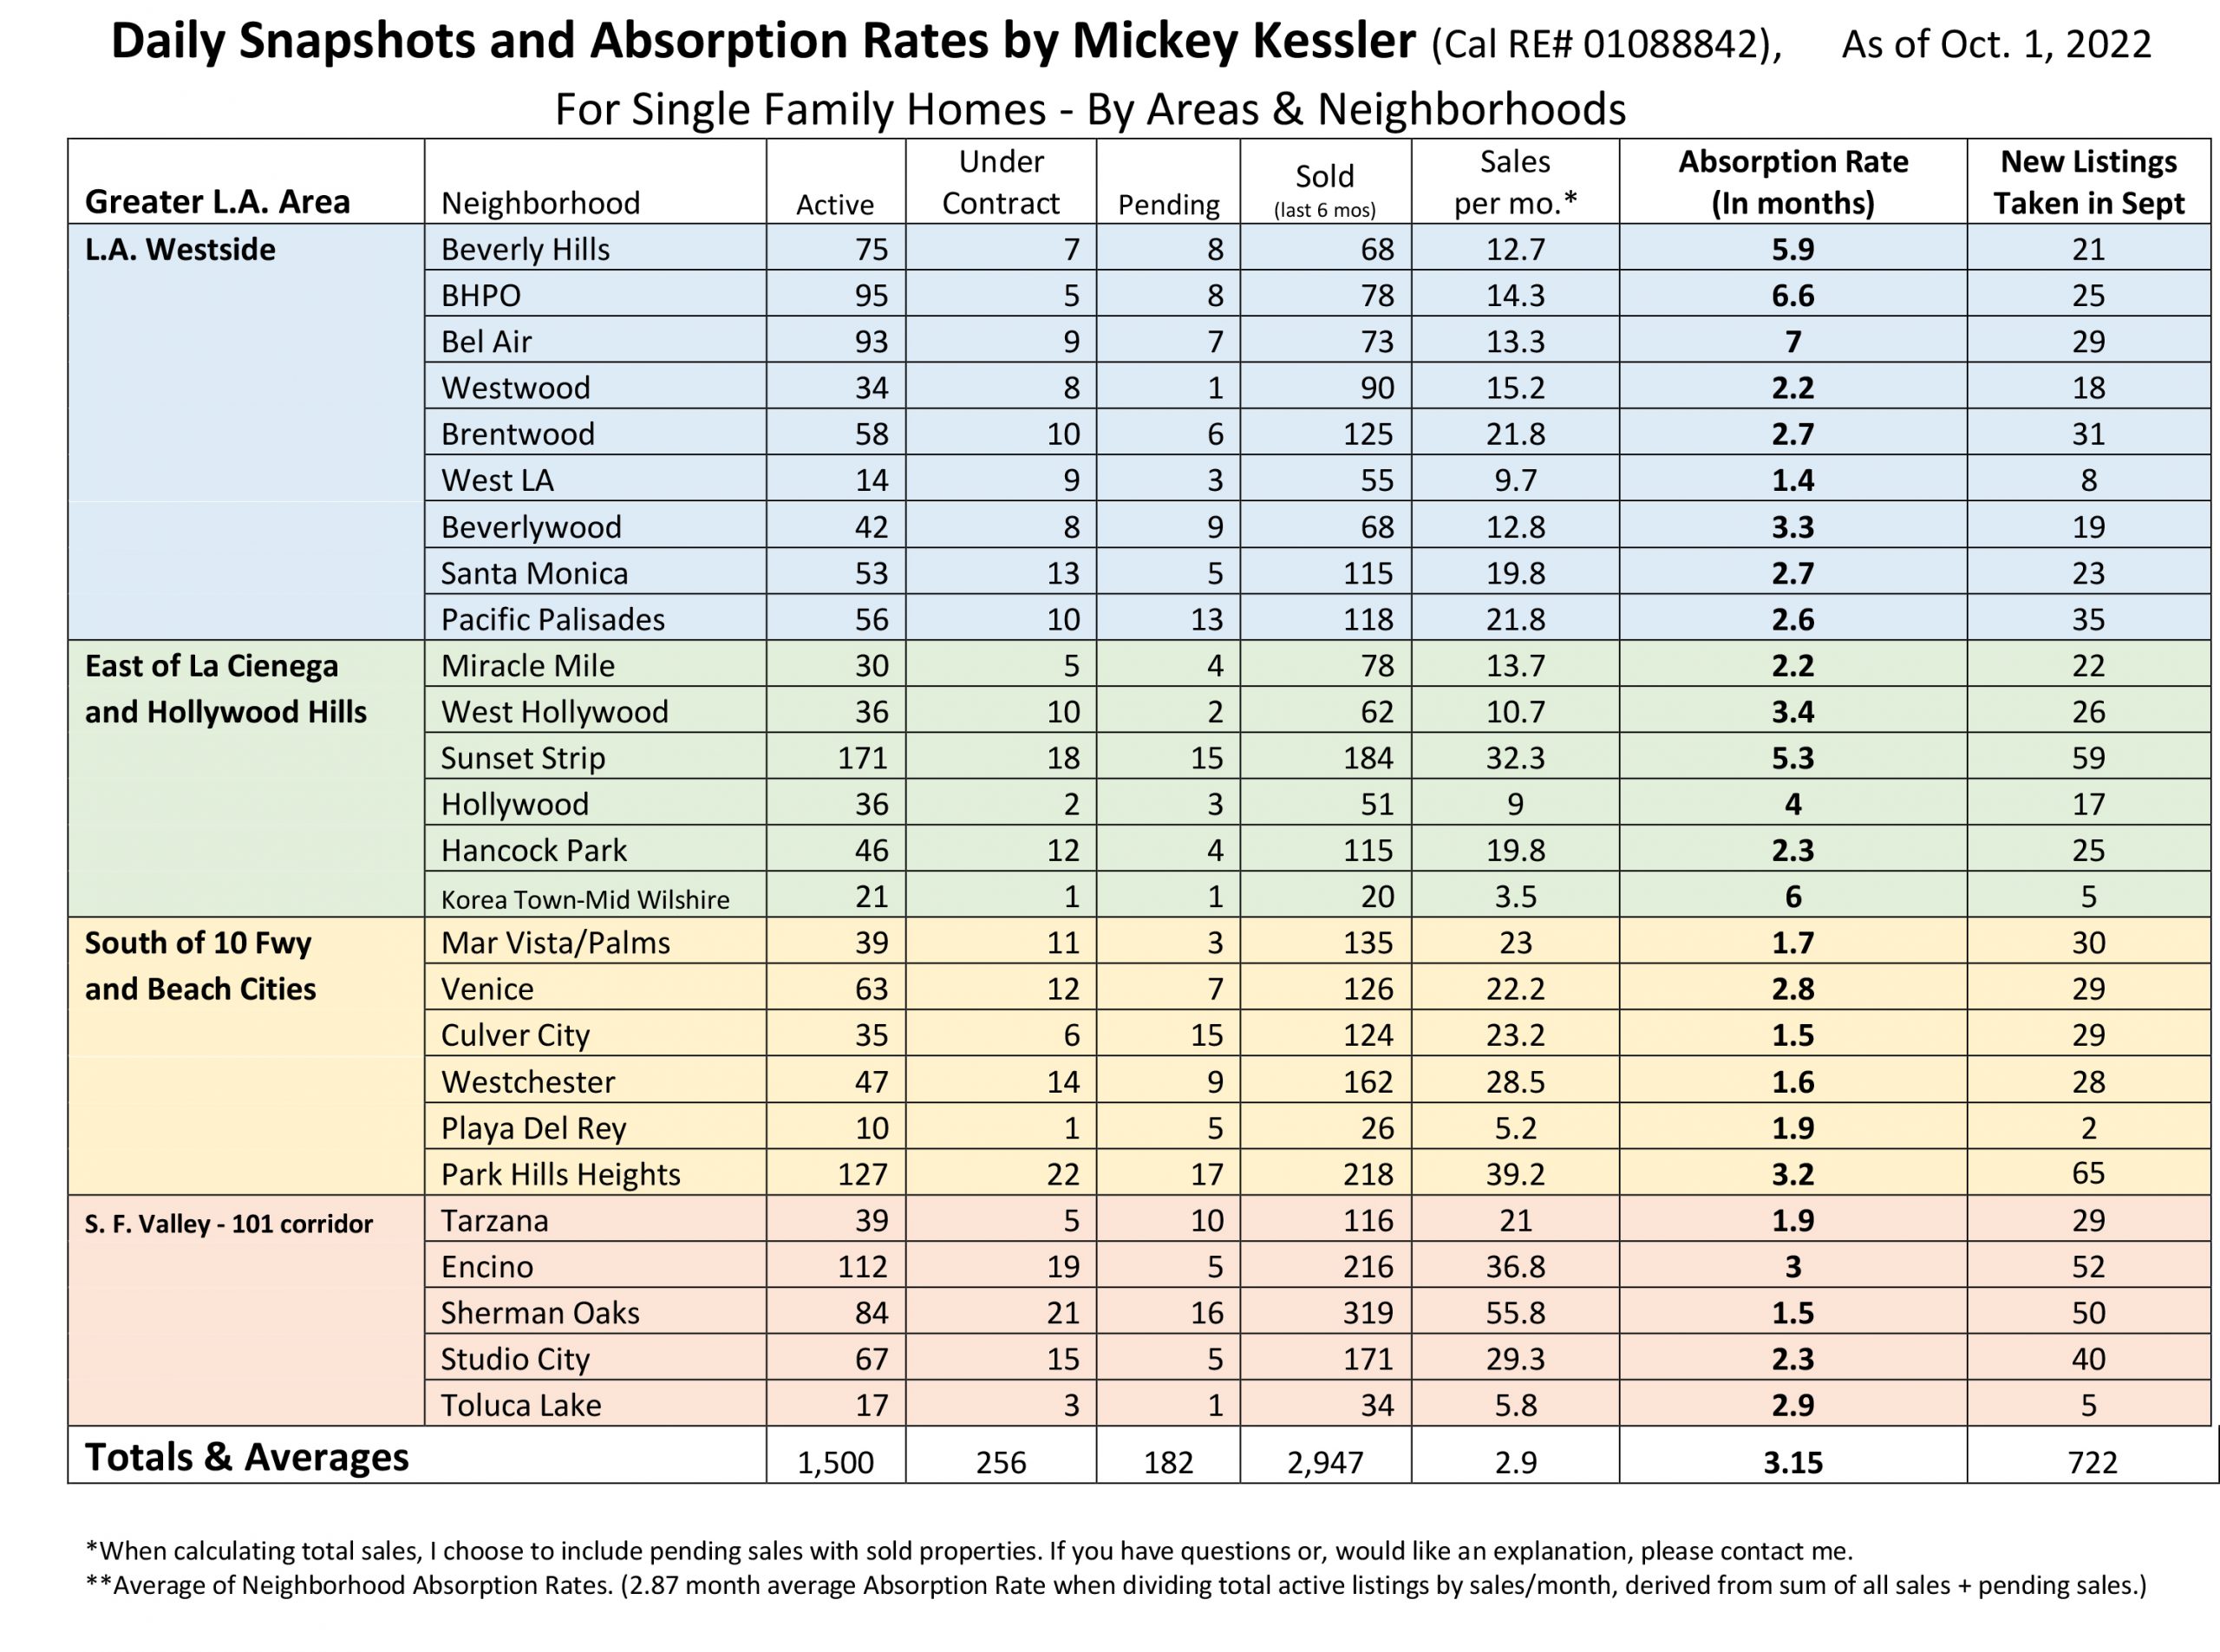
It should be noted, however that the absorption rates for most all of these “seller’s market” neighborhoods have modestly increased over the last 12+ months (see below).
Lastly, If you direct your attention to the column displaying the ratio of sold listings to off market sales, notice how many sales occurred off-market, particularly in the Beverlywood, Hollywood, Korea Town and Toluca Lake neighborhoods. This “hidden inventory” is making up a considerable share of the sales activity.