Facebook
 X
X
 Pinterest
 Copy Link
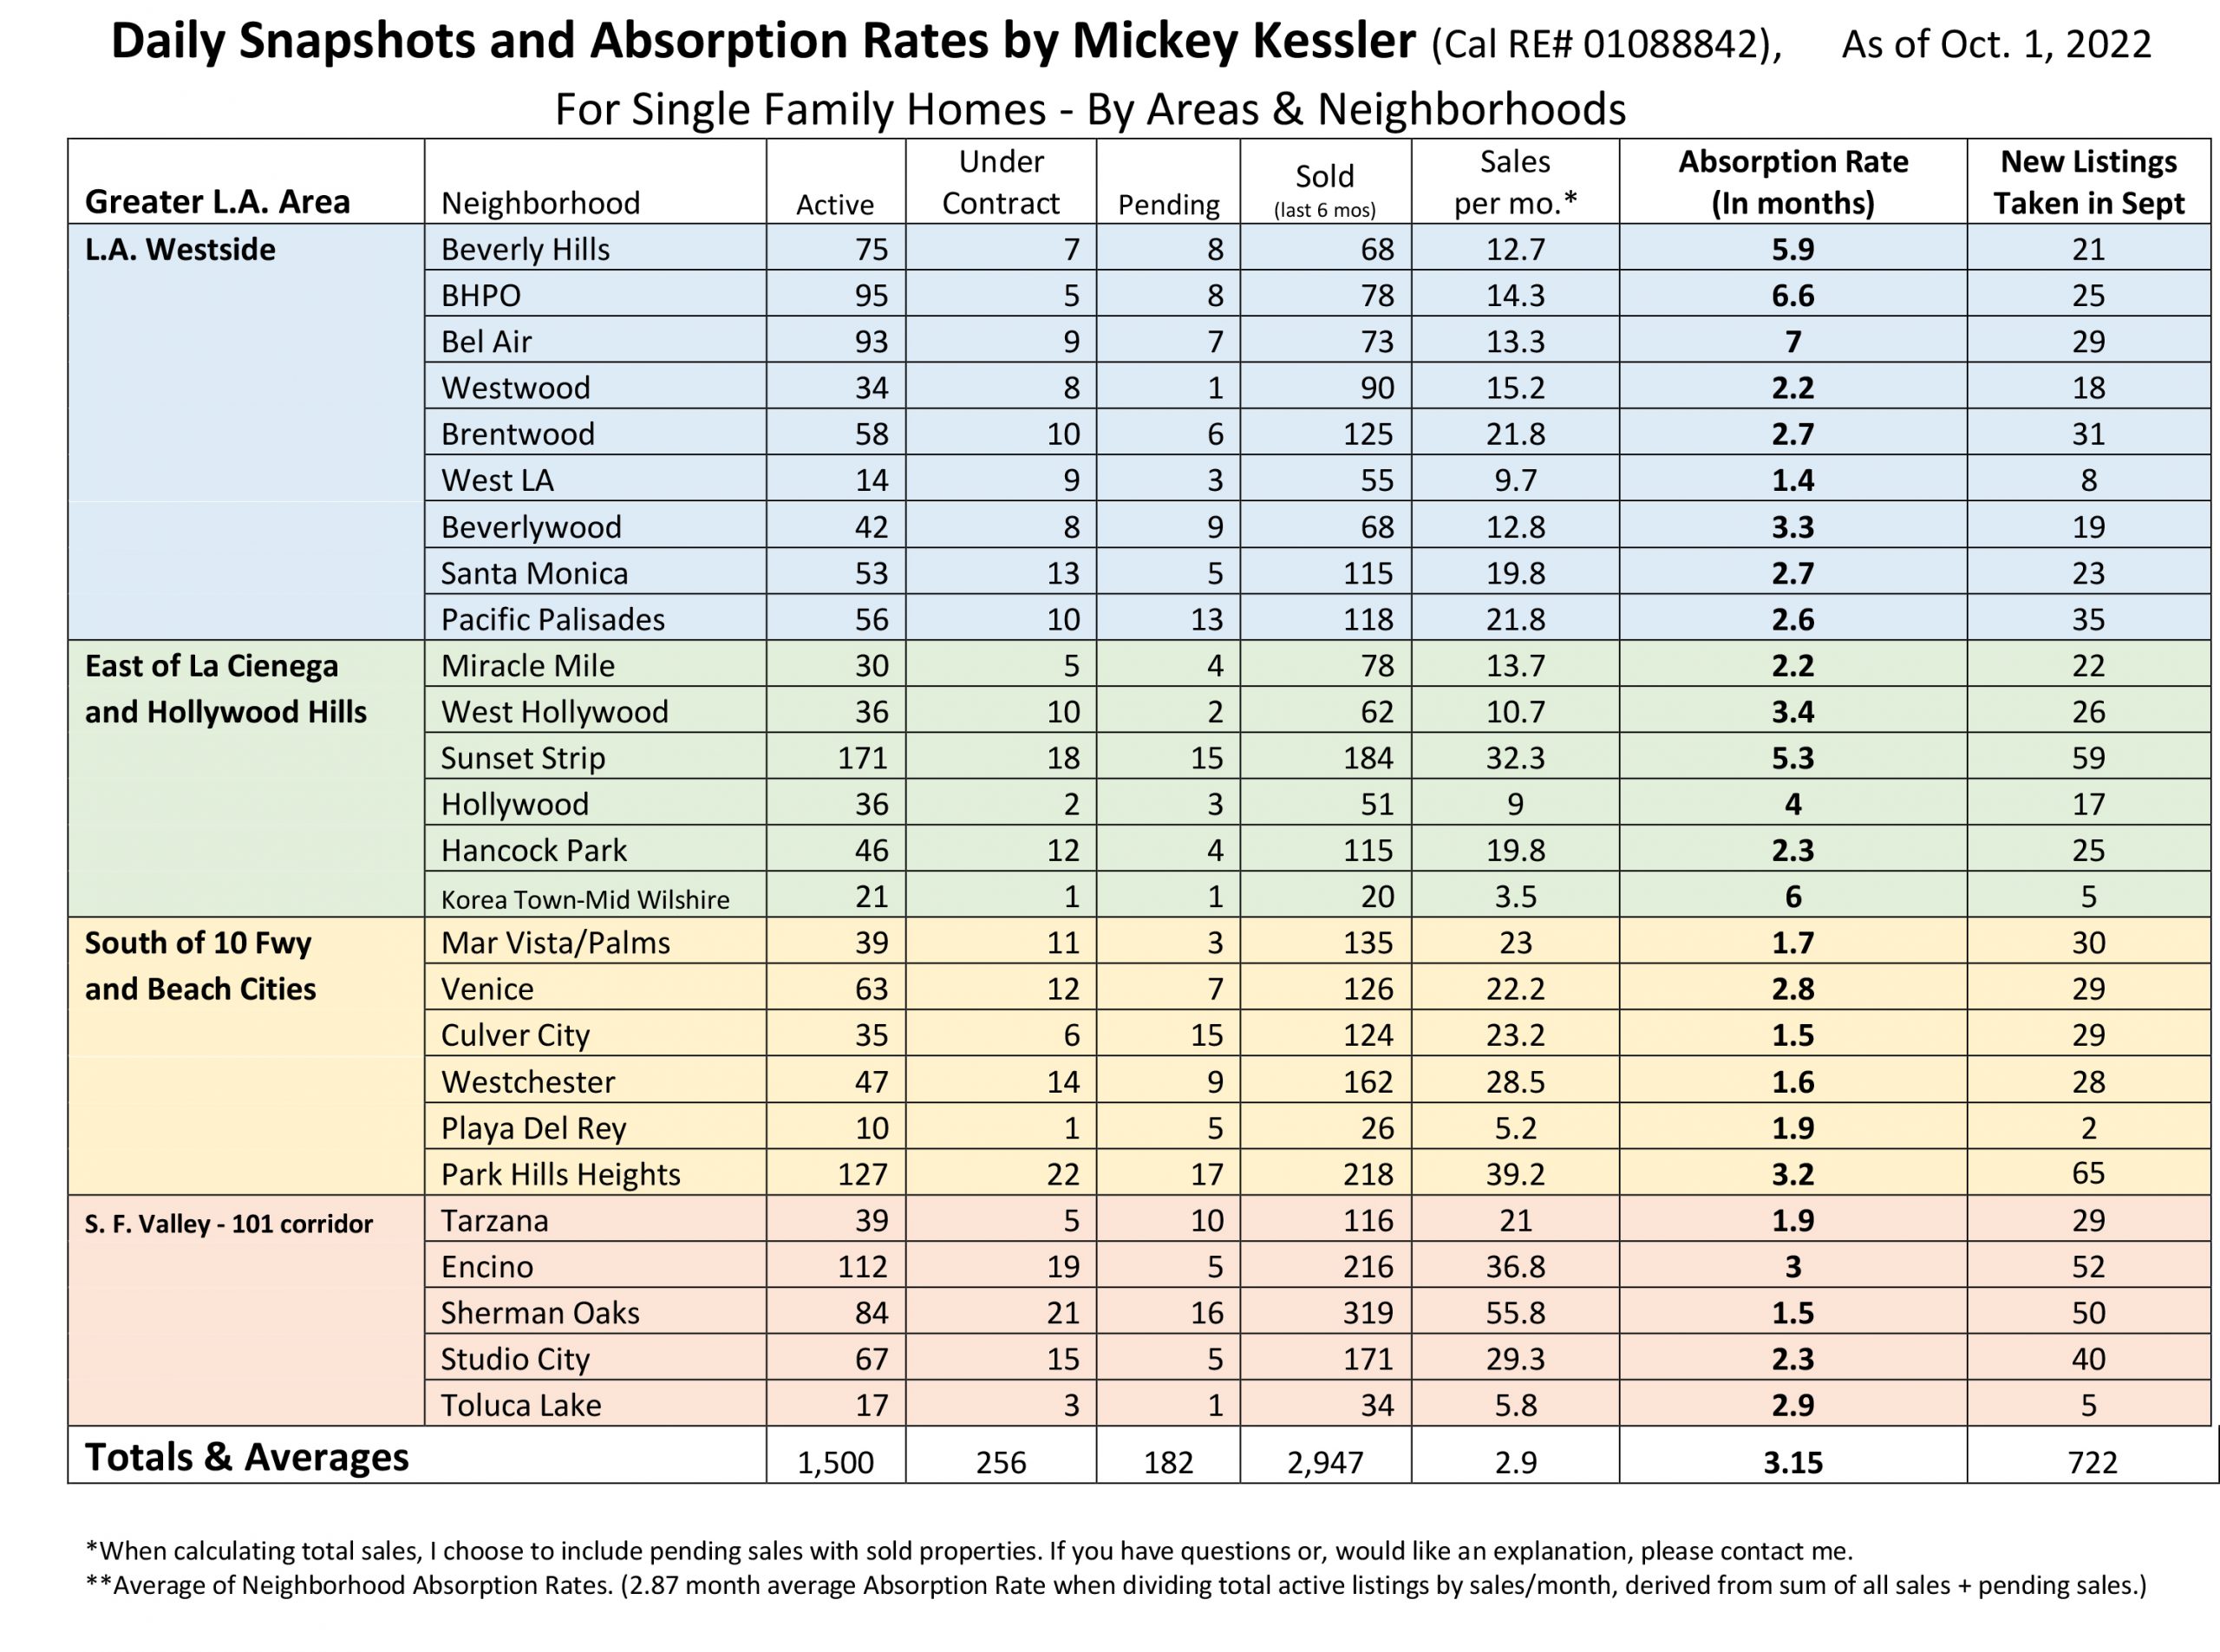
Forget about average sale price, mean sale price, price reductions, high sales price, average price per square foot and so on. If you want to really know how hot the market is, the best way to measure the market is using Absorption Rates. (See Chart Below)
Absorption Rates Explained
An Absorption Rate is a calculation that determines how fast property is coming on, and going off (i.e. selling) the market, expressed in months. It is the most elegant of statistics used to measure market dynamics because it is a calculation that measures Supply & Demand in it’s purest sense. Expressed another way: Absorption Rate is the rate (in number of months) that it will take for all the active listings (homes on the market) to sell-off, if no more listings were to come off on the market. It can be calculated for one, or many areas.
Note: I include “Pending Sales” (not to be confused with active listings that are “Under Contract”), when determining sales per month. I do so because most often, pending sales have removed all contingencies and are poised to close escrow but, haven’t yet recorded. By including these I believe that I am including sales that are about to become sales. i.e. the most recent sales data available and thus, my method includes the most current trends in market activity. If you don’t believe that Pending Sales should be included, simply leave them out when you do your calculations.How is it calculated?
First– Determine sales/month: Number of sales over prior 6 months, divided by number of months (6).
Next- Determine the absorption rate by dividing Active listings/Sales per month. The resulting figure is the Absorption Rate.So, now that I’ve go this data, what do I do with it.
The absorption rate is an indication of whether the current real estate market is a “Seller’s Market” or a “Buyer’s Market”. An absorption rate of 0-4 months would be considered a Seller’s Market. A rate of 6 or more months would be characteristic of a Buyer’s market and the 5 month absorption rate in between would describe a market in balance between buyer and seller markets (or, since real estate markets are rarely stagnant, this middle ground could be seen as a real estate market that is in transition from Seller Market to Buyer Market, or vise versa).In addition, tracking changes in absorption rates from month to month can provide insights into changes in the “heat” of the real estate market. As you review the absorption rates posted below, see if you agree with the news media outlets that claim that it is now a “Buyer’s Market” and that homes are sitting and not selling. Overall, this data tells a very different story.